Managing multinodal architectures can sometimes be painful, specially regarding logs management. Of course you don’t want to connect to every host individually to see what happens..That’s the main reason that motivated the support of syslog inside the n3rv logging component.
Through this tutorial we will see how to setup a centralized log management system with ES, FileBeat & Kibana, and how to program n3rv to use it.
We will assume that the guest OS for your centralized logging system is an Ubuntu Linux (it should be easilly transposable to other Distros/ OSes though)
wget -qO - https://artifacts.elastic.co/GPG-KEY-elasticsearch | sudo apt-key add -
echo "deb https://artifacts.elastic.co/packages/7.x/apt stable main" | sudo tee -a /etc/apt/sources.list.d/elastic-7.x.list

sudo apt-get install apt-transport-https elasticsearch filebeat kibana
/etc/init.d/elasticsearch start
In /etc/kibana/kibana.yml, set the follwing parameters:
server.port "5601"
server.host "localhost"
elasticsearch.hosts: ["http://localhost:9200"]
Finally you can start Kibana:
/etc/init.d/kibana start
The Kibana user interface should now be accessible on http://localhost:5601
Now You will have to add a syslog input in the filebeat.inputs section of /etc/filebeat/filebeat.yml:
filebeat.inputs:

 - type: syslog
    enabled: true
    protocol.udp:
        host: ":514"
You are now ready to restart filebeat:
/etc/init.d/filebeat restart
Now that our centralized logs repository is setup, we will need to configure our hosts to send its syslog entries on it. To do it, Add the required entries in /etc/rsyslog.conf:
user.* @FileBeat_Host:514
Note: Replace FileBeat_Host by the IP/Hostname of your filebeat server.
At this step, all the remains is to add the correct syslog destinations in your n3rv logger objects:
#include <n3rv/n3rvcommon.hpp>
#include <n3rv/n3rvservice.hpp>
#include <n3rv/n3rvservicecontroller.hpp>

int main() {

    n3rv::logger* ll = new n3rv::logger(n3rv::LOGLV_DEBUG);
    /* We tell the logger to use syslog as dest. */
    ll->add_dest("syslog:svc:user");

    n3rv::start_controller("0.0.0.0",10001,ll);
    n3rv::service svc1("127.0.0.1",10001,ll);

    svc1.run_async();
}
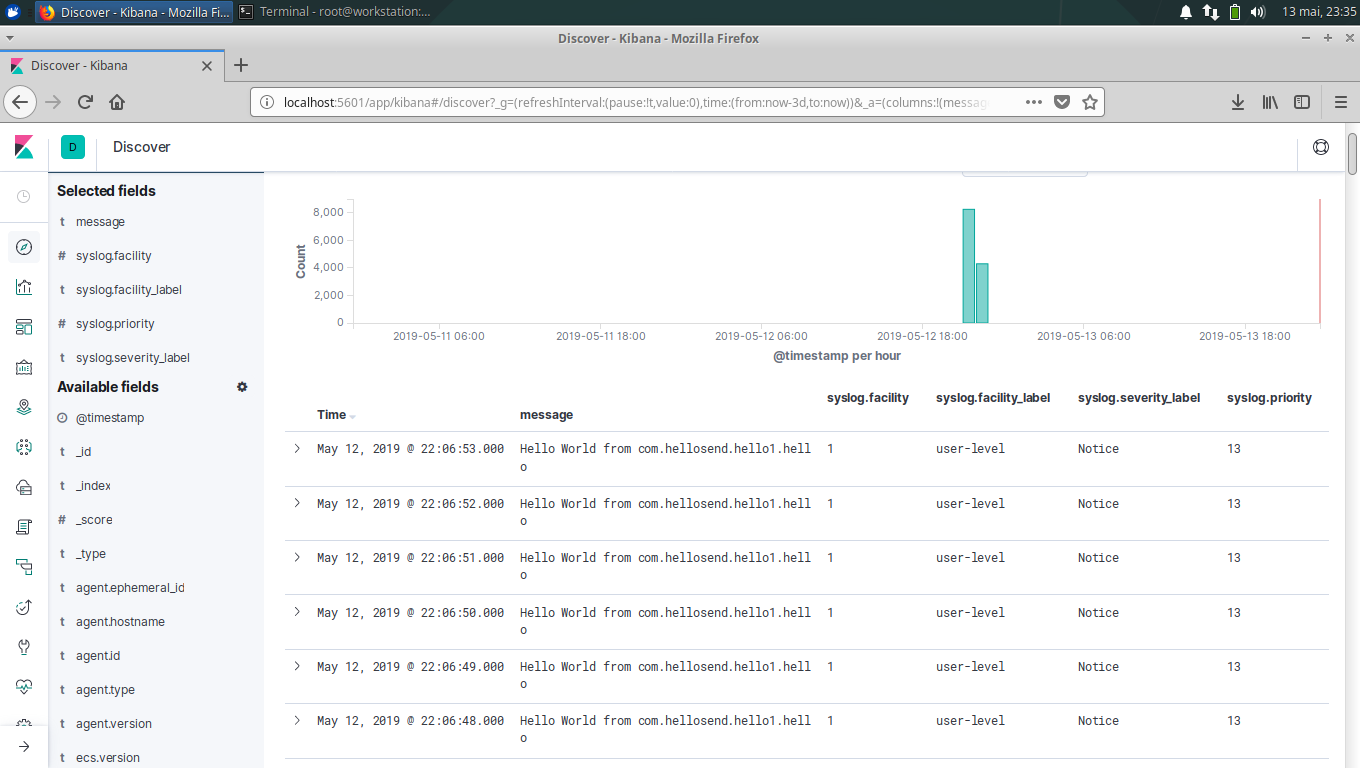
At the end, you should see the logs of all your nodes available on the Kibana interface: